Budget Optimizer: Find Extra Money for Debt Payoff
Optimize your budget to find extra money for debt payoff using the proven 50/30/20 rule.
How This Budget Optimizer Calculator Works
Our budget optimizer calculator analyzes your income and expenses against the 50/30/20 budgeting framework to show:
- Current allocation – Where your money actually goes
- Optimal allocation – Where your money should go
- Gap analysis – Areas that need adjustment
- Extra money found – Potential for debt payoff or savings
- Personalized recommendations – Specific actions to improve
Stop wondering where your money goes. Start optimizing where it should go.
The 50/30/20 Rule Explained
What Is the 50/30/20 Rule✓
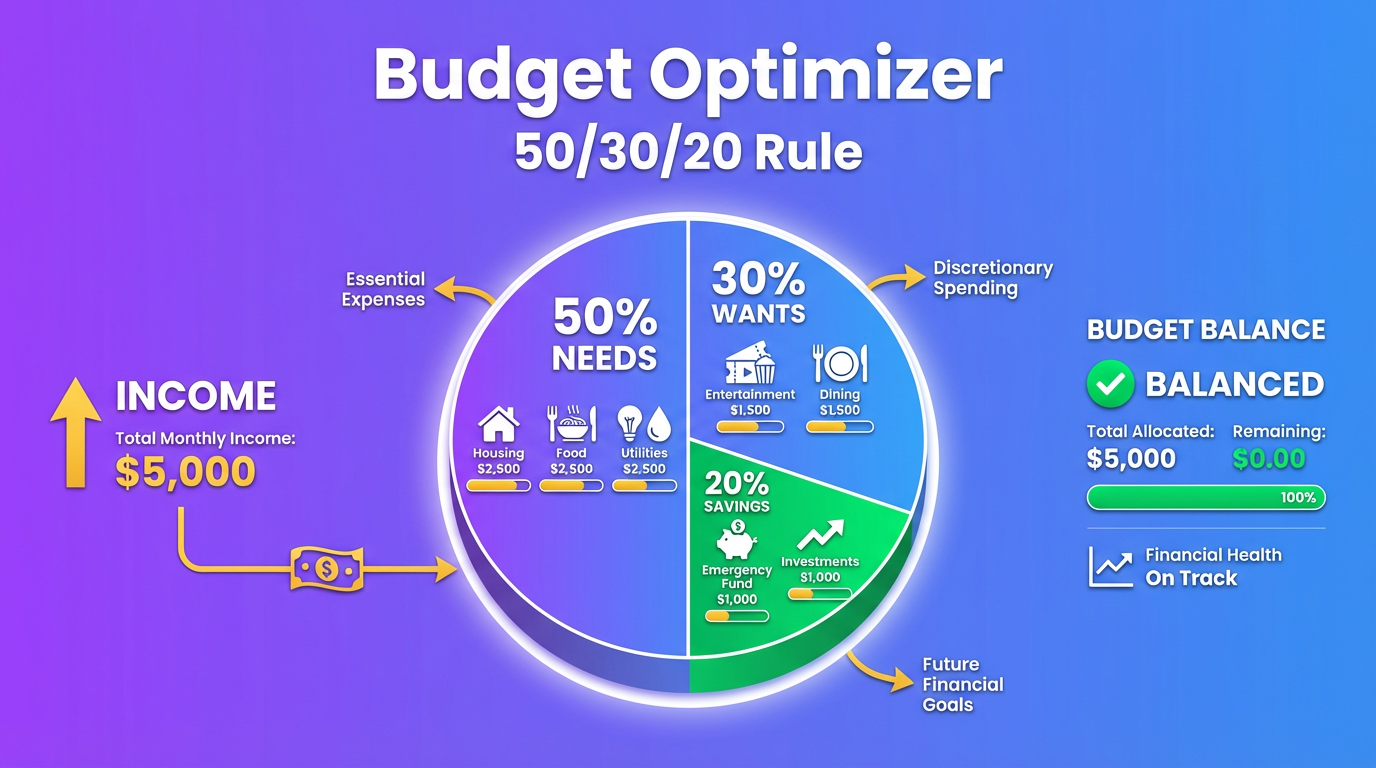
The 50/30/20 rule is a simple budgeting framework that divides your after-tax income into three categories:
| Category | Percentage | Purpose |
|---|---|---|
| Needs | 50% | Essential expenses you must pay |
| Wants | 30% | Lifestyle expenses you enjoy |
| Savings/Debt | 20% | Building wealth or paying off debt |
What Goes in Each Category✓
Needs (50%) – Housing (rent/mortgage) – Utilities (electric, gas, water, internet) – Groceries (not dining out) – Transportation (car payment, insurance, gas, transit) – Health insurance premiums – Minimum debt payments – Childcare (if required for work) – Basic clothing
Wants (30%) – Dining out and entertainment – Streaming services and subscriptions – Hobbies and recreation – Travel and vacations – Shopping (non-essential) – Gym membership – Upgraded phone/electronics – Personal care beyond basics
Savings/Debt (20%) – Emergency fund – Retirement contributions – Extra debt payments (above minimums) – Other savings goals – Investments
Budget Optimizer Examples: Real Scenarios
Example 1: The Overspender on “Wants” ($5,000/month)
Scenario: Ashley earns $5,000/month after taxes and wonders why she can’t save.
Current Budget: | Category | Amount | Percentage | Target | |———-|——–|————|——–| | Needs | $2,100 | 42% | 50% | | Wants | $2,400 | 48% | 30% | | Savings/Debt | $500 | 10% | 20% | | Total | $5,000 | 100% | — |
Analysis: – ✓ Needs: Under target (good!) – ✗ Wants: 18 percentage points over budget – ✗ Savings/Debt: 10 points under target
Where the Wants Money Goes: | Expense | Current | Optimized | Savings | |———|———|———–|———| | Dining out | $600 | $300 | $300 | | Entertainment | $350 | $200 | $150 | | Shopping | $500 | $250 | $250 | | Subscriptions | $150 | $75 | $75 | | Miscellaneous | $800 | $675 | $125 | | Total Wants | $2,400 | $1,500 | $900 |
Optimized Budget: | Category | Optimized | Percentage | |———-|———–|————| | Needs | $2,100 | 42% | | Wants | $1,500 | 30% | | Savings/Debt | $1,400 | 28% |
Result: Ashley found $900/month for savings and debt payoff by cutting wants to target.
Example 2: Housing-Heavy Budget ($4,200/month)
Scenario: Marcus’s rent takes a huge chunk of his income.
Current Budget: | Category | Amount | Percentage | Target | |———-|——–|————|——–| | Needs | $2,900 | 69% | 50% | | Wants | $1,050 | 25% | 30% | | Savings/Debt | $250 | 6% | 20% | | Total | $4,200 | 100% | — |
Needs Breakdown: | Expense | Amount | % of Income | |———|——–|————-| | Rent | $1,800 | 43% | | Utilities | $150 | 4% | | Car payment | $350 | 8% | | Car insurance | $120 | 3% | | Gas | $150 | 4% | | Groceries | $300 | 7% | | Health insurance | $30 | 1% | | Total Needs | $2,900 | 69% |
The Problem: Rent alone is 43% of income. The rule suggests total housing costs (rent + utilities) should be 25-30% max.
Options to Optimize:
Option A: Find Cheaper Housing – Target rent: $1,100-$1,250 (25-30%) – Savings: $550-$700/month – Challenge: May require moving, roommate, or different area
Option B: Increase Income – To afford $1,800 rent at 30%: Need $6,000/month income – Gap: $1,800/month increase needed – Challenge: Significant income jump required
Option C: Hybrid Approach – Reduce rent to $1,400 (roommate) – Increase income by $400/month (side gig) – New rent-to-income: 30% – More achievable balance
Realistic Optimized Budget (Option C): | Category | Optimized | Percentage | |———-|———–|————| | Needs | $2,500 | 54% | | Wants | $1,050 | 23% | | Savings/Debt | $1,050 | 23% |
Result: Combination approach adds $800/month to savings/debt category.
Example 3: The Debt-Focused Budget ($6,500/month)
Scenario: The Parkers want to aggressively pay off $35,000 in debt.
Current Budget: | Category | Amount | Percentage | Target | |———-|——–|————|——–| | Needs | $3,400 | 52% | 50% | | Wants | $2,100 | 32% | 30% | | Savings/Debt | $1,000 | 15% | 20% | | Total | $6,500 | 100% | — |
Goal: Accelerate debt payoff by increasing debt payments
Standard 50/30/20 Optimization: | Category | Optimized | Amount | |———-|———–|——–| | Needs | 50% | $3,250 | | Wants | 30% | $1,950 | | Savings/Debt | 20% | $1,300 |
Extra for debt: $300/month → Debt-free 7 months sooner
Aggressive 50/20/30 (Debt Focus): | Category | Optimized | Amount | |———-|———–|——–| | Needs | 50% | $3,250 | | Wants | 20% | $1,300 | | Savings/Debt | 30% | $1,950 |
Extra for debt: $950/month → Debt-free 22 months sooner
Gazelle Intense (Extreme): | Category | Optimized | Amount | |———-|———–|——–| | Needs | 50% | $3,250 | | Wants | 10% | $650 | | Savings/Debt | 40% | $2,600 |
Extra for debt: $1,600/month → Debt-free 31 months sooner
Impact on $35,000 Debt (20% APR): | Strategy | Monthly to Debt | Payoff Time | Interest Paid | |———-|—————–|————-|—————| | Current | $1,000 | 51 months | $15,234 | | Standard 50/30/20 | $1,300 | 44 months | $12,456 | | Aggressive 50/20/30 | $1,950 | 29 months | $7,892 | | Gazelle Intense | $2,600 | 20 months | $5,123 |
Example 4: Variable Income Budget ($4,800 average)
Scenario: Jordan is a freelancer with income ranging from $3,000 to $7,000/month.
The Challenge: 50/30/20 is harder with variable income
Solution: Budget on Baseline Income
Step 1: Establish baseline – Lowest typical month: $3,500 – Use this for baseline budget
Baseline Budget ($3,500): | Category | Amount | Percentage | |———-|——–|————| | Needs | $1,750 | 50% | | Wants | $700 | 20% | | Savings/Debt | $1,050 | 30% |
Note: Wants reduced to 20% and savings increased to 30% for income stability.
Step 2: Create “Overflow Rules”
When income exceeds baseline: | Extra Income | Allocation | |————–|————| | First $500 | Emergency fund (until 6 months saved) | | Next $500 | Extra debt payment | | Beyond $1,000 | 50% savings, 30% taxes, 20% wants |
Example High Month ($6,000): – Baseline budget: $3,500 – Extra: $2,500 – First $500 → Emergency fund – Next $500 → Debt payment – Remaining $1,500 → 50% savings ($750), 30% taxes ($450), 20% wants ($300)
Result: Jordan builds stability by budgeting on worst-case and strategically using windfalls.
Example 5: Retired/Fixed Income Budget ($3,200/month)
Scenario: The Hendersons live on Social Security and pension.
Current Budget: | Category | Amount | Percentage | |———-|——–|————| | Needs | $2,400 | 75% | | Wants | $600 | 19% | | Savings | $200 | 6% | | Total | $3,200 | 100% |
Analysis: Needs consume 75%—well above 50% target. This is common for retirees with fixed income.
Needs Breakdown: | Expense | Amount | |———|——–| | Housing | $950 | | Utilities | $200 | | Health insurance/Medicare | $350 | | Medications | $250 | | Groceries | $400 | | Car/Transportation | $250 | | Total | $2,400 |
Optimization Opportunities:
| Area | Current | Optimized | Savings |
|---|---|---|---|
| Medicare plan review | $350 | $280 | $70 |
| Generic medications | $250 | $175 | $75 |
| Grocery strategies | $400 | $350 | $50 |
| Utility efficiency | $200 | $170 | $30 |
| Total Savings | — | — | $225 |
Optimized Budget: | Category | Amount | Percentage | |———-|——–|————| | Needs | $2,175 | 68% | | Wants | $600 | 19% | | Savings/Emergency | $425 | 13% |
Reality Check: For fixed-income retirees, 50/30/20 may not be achievable. Focus on: 1. Keeping needs as low as possible 2. Maintaining small emergency fund 3. Enjoying reasonable wants without guilt
Finding Money in Your Budget
The Expense Audit Method
Step 1: Track Everything for 30 Days – Every purchase, no matter how small – Use app, spreadsheet, or notebook – Categorize as Need, Want, or Savings
Step 2: Identify Surprise Spending Common money leaks: | Category | Common Leaks | Typical Waste | |———-|————–|—————| | Subscriptions | Unused services | $50-$150/month | | Dining out | Lunch, coffee, delivery | $200-$500/month | | Impulse shopping | Amazon, Target runs | $100-$300/month | | Convenience fees | ATM, delivery, rush | $25-$75/month | | Bank fees | Overdraft, maintenance | $20-$50/month |
Step 3: Cut the Leaks
Subscriptions Audit: | Service | Cost | Used✓ | Action | |———|——|——-|——–| | Netflix | $15 | Weekly | Keep | | Hulu | $13 | Monthly | Consider | | HBO Max | $16 | Rarely | Cancel | | Gym | $50 | Never | Cancel | | Magazine | $12 | Never | Cancel | | Savings | — | — | $78/month |
The 24-Hour Rule
Before any non-essential purchase over $50: 1. Wait 24 hours 2. Ask: “Do I still want this✓” 3. If yes after 24 hours, budget allows, buy it 4. If no, you just saved money
Result: Most impulse purchases fade after waiting.
The Substitution Strategy
| Instead of This | Do This | Monthly Savings |
|---|---|---|
| $5 coffee daily | Make at home | $100+ |
| $15 lunch daily | Meal prep | $200+ |
| Cable TV | Streaming only | $50-$100 |
| Gym membership | Home workouts | $30-$80 |
| New books | Library | $30-$50 |
| Brand name groceries | Store brand | $50-$100 |
Budget Frameworks Beyond 50/30/20
Alternative Budgeting Methods
80/20 Budget (Simplified) – 20% to savings/debt first – 80% for everything else – No detailed tracking required – Best for: People who hate budgeting
70/20/10 Budget (Conservative) – 70% needs and wants combined – 20% savings – 10% giving/charitable – Best for: Those with giving priorities
60/20/20 Budget (Dave Ramsey-inspired) – 60% needs – 20% wants – 20% savings/debt – Best for: Higher cost-of-living areas
Zero-Based Budget – Every dollar assigned a job – Income – Expenses = $0 – Most detailed and controlled – Best for: Serious budgeters, debt payoff
When 50/30/20 Doesn’t Fit
High cost-of-living areas: – Housing alone may exceed 30% – Consider 60/20/20 or 70/20/10 – Focus on increasing income
Very low income: – Needs may dominate budget – Focus on covering basics first – Any savings is progress
Aggressive debt payoff: – Temporarily reduce wants to 10-20% – Put 30-40% to debt – Return to 50/30/20 after debt-free
High income: – May not need full 50% for needs – Can increase savings to 30-40% – Build wealth faster
Creating Your Optimized Budget
Step-by-Step Budget Creation
Step 1: Calculate After-Tax Income – Take-home pay (not gross) – Include all income sources – Use average if variable
Step 2: List All Expenses – Review 3 months of bank/card statements – Categorize each expense – Note frequency (monthly, annual, occasional)
Step 3: Categorize as Need, Want, or Savings – Be honest—many “needs” are wants – Housing, utilities, basic food = needs – Dining out, entertainment = wants
Step 4: Calculate Current Percentages
Category Amount ÷ Total Income × 100 = PercentageStep 5: Compare to 50/30/20 Targets – Where are you over✓ – Where are you under✓ – What can change✓
Step 6: Set Realistic Targets – Don’t go extreme immediately – Gradual changes stick better – Aim for improvement, not perfection
Step 7: Automate What You Can – Auto-transfer to savings on payday – Auto-pay bills – Auto-invest in retirement
Frequently Asked Questions
What is the 50/30/20 budget rule✓
The 50/30/20 rule divides your after-tax income into three categories:
| Category | Percentage | Includes |
|---|---|---|
| Needs | 50% | Housing, utilities, groceries, transportation, insurance, minimum debt payments |
| Wants | 30% | Entertainment, dining out, shopping, subscriptions, hobbies |
| Savings/Debt | 20% | Emergency fund, retirement, extra debt payments, investments |
It’s a simple framework popularized by Senator Elizabeth Warren in her book “All Your Worth.”
How do I know if something is a need or want✓
The Test: Can you survive without it✓
| Expense | Need or Want✓ | Why |
|---|---|---|
| Rent | Need | You need shelter |
| Netflix | Want | Entertainment, not survival |
| Basic groceries | Need | You need food |
| Organic groceries | Want (the upgrade) | Basic food is the need |
| Car for work | Need | Required for income |
| Premium car | Want (the upgrade) | Basic transport is the need |
| Internet | Need (usually) | Required for work/life |
| Fastest internet | Want (the upgrade) | Basic service is the need |
Gray areas: Consider minimum necessary vs. preferred version.
What if my needs exceed 50%✓
Common in high-cost areas. Options:
- Accept modified targets – 60/25/15 may be realistic
- Reduce needs where possible – Roommate, cheaper housing, lower car costs
- Increase income – Side gig, promotion, new job
- Move to lower-cost area – If feasible
- Eliminate needs temporarily – Sell car, reduce to one vehicle
Focus on gradual improvement rather than immediate perfection.
Should debt payments count as needs or savings✓
Minimum payments = Needs (must be paid) Extra payments = Savings/Debt (wealth building)
Example: – Credit card minimum: $150 → Needs – Extra payment: $200 → Savings/Debt category
This ensures minimums are always covered while extra payments come from your wealth-building allocation.
How much should I budget for groceries✓
General guidelines by household size:
| Household | Thrifty | Moderate | Liberal |
|---|---|---|---|
| 1 person | $200-$250 | $300-$350 | $400-$500 |
| 2 people | $350-$450 | $500-$600 | $700-$850 |
| Family of 4 | $550-$700 | $800-$1,000 | $1,100-$1,400 |
Tips to reduce: – Meal plan before shopping – Buy store brands – Reduce meat consumption – Use grocery apps for deals – Shop sales and stock up
What percentage should go to housing✓
Traditional recommendation: 25-30% of gross income (or 30-35% of after-tax)
Including: – Rent OR mortgage payment – Property taxes (if not in mortgage) – Renter’s/homeowner’s insurance – HOA fees – Basic utilities (some include, some don’t)
If above 30%: Consider ways to reduce or plans to increase income.
How do I budget with irregular income✓
Strategy 1: Budget on baseline – Use your lowest typical month – Anything above goes to savings first
Strategy 2: Average income budgeting – Calculate 6-12 month average – Build 3-month buffer during high months – Draw from buffer during low months
Strategy 3: Priority-based allocation – List expenses in priority order – Pay most critical first – Wants only if income allows
Should I budget for annual expenses✓
Yes! Divide annual expenses by 12 and save monthly:
| Annual Expense | Amount | Monthly Savings |
|---|---|---|
| Car insurance | $1,200 | $100 |
| Property taxes | $3,000 | $250 |
| Holiday gifts | $600 | $50 |
| Car maintenance | $800 | $67 |
| Vacation | $2,000 | $167 |
| Total | $7,600 | $634 |
This prevents “surprise” bills from derailing your budget.
Is 50/30/20 realistic for everyone✓
No, but it’s a useful framework.
| Situation | Adjusted Approach |
|---|---|
| Low income | Focus on needs, any savings is progress |
| High cost of living | 60/25/15 may be more realistic |
| Aggressive debt payoff | 50/20/30 or 50/10/40 temporarily |
| High income | 40/20/40 to build wealth faster |
| Retirees | Needs often higher, adjust accordingly |
Use 50/30/20 as a starting point, then adjust for your reality.
How do I stick to a budget✓
Proven strategies:
- Automate savings – Transfer on payday before you can spend
- Use cash for wants – Physical spending feels more real
- Track weekly – Don’t wait until month end
- Allow small splurges – Overly strict budgets fail
- Budget “fun money” – Guilt-free spending allocation
- Review monthly – Adjust what isn’t working
- Find accountability – Partner, friend, or online community
What’s the best budgeting app✓
Popular options:
| App | Best For | Cost |
|---|---|---|
| YNAB | Zero-based budgeting | $14.99/month |
| Mint | Automatic tracking | Free |
| EveryDollar | Dave Ramsey method | Free (basic) |
| Copilot | Apple users | $70/year |
| Monarch Money | Couples | $9.99/month |
| Spreadsheet | Full control | Free |
Best choice: The one you’ll actually use consistently.
How long does it take to optimize a budget✓
Timeline:
| Phase | Time | Goal |
|---|---|---|
| Awareness | Month 1 | Track all spending |
| Analysis | Month 2 | Identify patterns, leaks |
| Adjustment | Month 3-4 | Implement changes |
| Optimization | Month 5-6 | Fine-tune based on results |
| Maintenance | Ongoing | Monthly reviews, periodic updates |
Budget optimization is a process, not a one-time event. Expect 3-6 months to find your sustainable system.
Related Calculators
Complete your financial optimization:
- Emergency Fund Calculator – Know your savings target
- Debt Payoff Calculator – Plan your debt-free journey
- Debt-to-Income Calculator – Understand your financial health
- Financial Freedom Date Calculator – See when you’ll be debt-free
This calculator provides budgeting guidance based on the 50/30/20 framework. Individual financial situations vary. Adjust percentages to fit your specific circumstances and goals.